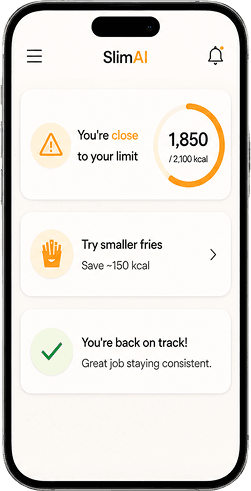



 featureProgress & Streaks
Progress and Streaks — See Consistency, Not Just Today
One stats screen, three tabs, one question each: what now, how am I doing, and how has my body changed — streaks, achievements, calorie and macro trends, weight movement, and body fat over time.
A daily dashboard answers one question — how is today going. It cannot tell you whether this week was better than last, whether you actually hit your macros four days running, or whether the number on the scale is moving for a reason.
The stats screen in SlimAI Calorie Tracker is where the days add up, and it is organised around one question per tab. Coach answers what to do now. Progress answers how you are doing, with the streaks, achievements, and charts behind it. Body answers how your body has actually changed. Eat smarter, not stricter.
Last updated

3-day free trial · Cancel anytime · No card charged during trial
Why Consistency Beats Any Single Day
Nobody loses or maintains weight because of one well-logged Tuesday. Results come from a pattern repeated long enough to matter, and a pattern is invisible if all you ever see is the current day.
That invisibility is why tracking stops. A person logs carefully for eleven days, misses two, feels like they failed, and quits — never seeing that eleven out of thirteen was a strong fortnight. Without a view of the streak, every gap feels like starting over.
SlimAI makes the pattern visible on purpose. Streaks, logged days, and perfect days turn effort into something you can look at, so a missed day reads as one gap in a run rather than proof the whole attempt collapsed.
Three Tabs, One Question Each
Most stats screens are a pile of charts with no argument. SlimAI splits the screen by the question you arrived with, so you are never scrolling past six graphs to find the one that answers you.
One shared scope bar sits under the tabs and drives all three: week or month, with arrows to step back through your history. Pick a week on Progress, move to Body, and you are still looking at the same week.
Coach — what now?
The narrative tab and the one that opens by default. Your trajectory, the week score, what went well and what to watch, what drove your calories, this week's lesson, and the weekly report. No charts — this tab is sentences.
Progress — how am I doing?
The evidence tab: streak strip, achievements, the calorie ring, calories and macros charted against target, and pattern cards.
Body — how has my body changed?
Body composition and body fat trend, weight with BMI inside it, the weight tracker, scan history, and progress over time.
History as far back as your account goes
The month picker is floored at the month you registered — a month before your account existed cannot hold data, so it is not offered.
Ready to try Progress & Streaks?
Snap a photo and SlimAI does the rest — 10K+ downloads on iOS and Android.
3-day free trial · Cancel anytime · No card charged during trial
The Progress Tab: Streaks, Logged Days, and Perfect Days
Progress is the consistency view. It answers "am I actually doing this" before it answers anything about outcomes.
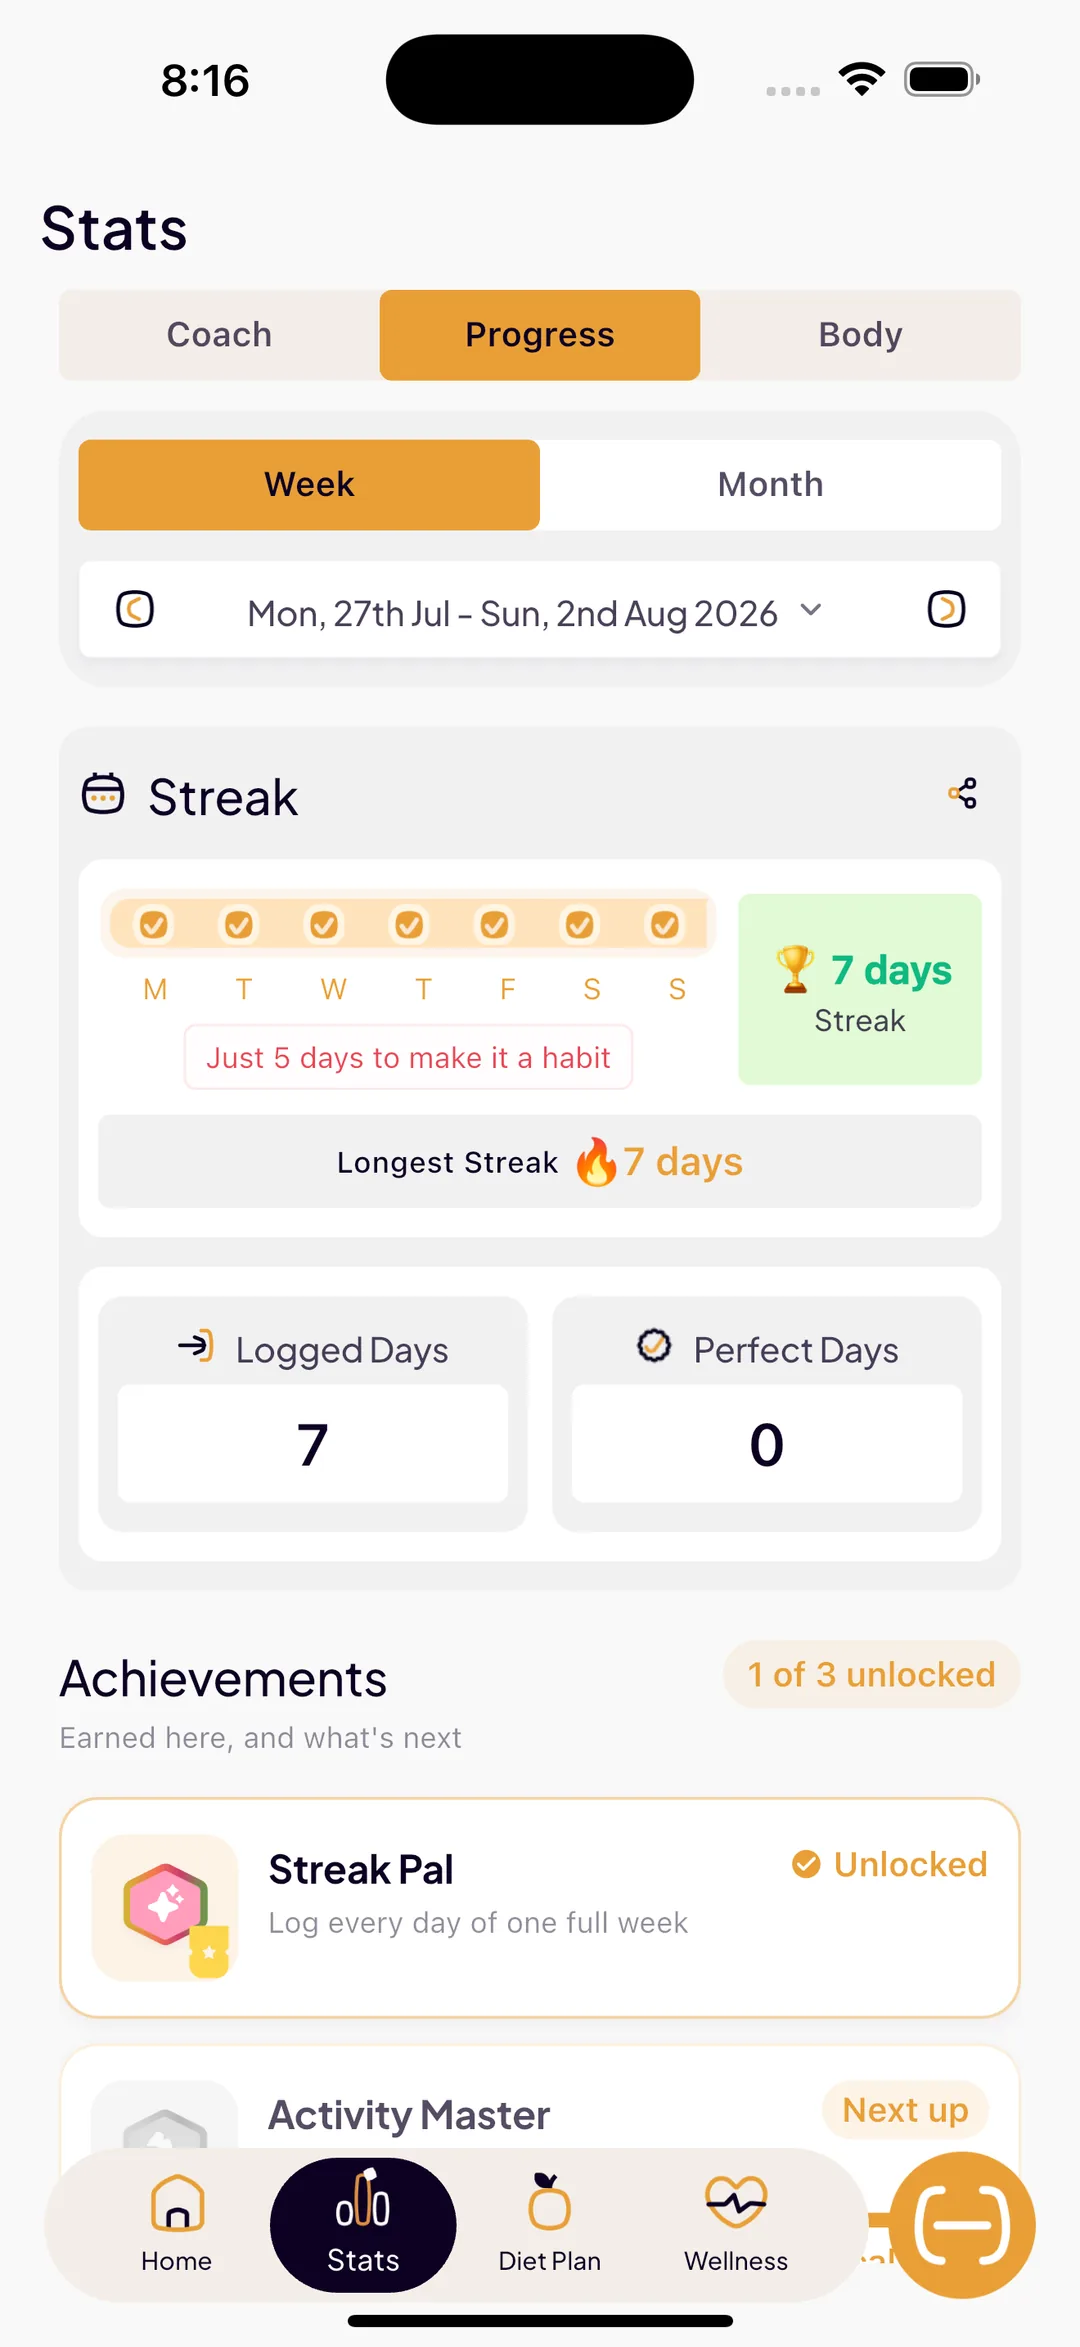
Longest Streak
Your best unbroken run of logged days, kept on screen as a record to beat rather than a counter that resets to nothing and disappears.
Logged Days
How many days you actually recorded food, so effort is measured by turning up rather than by hitting a target perfectly.
Perfect Days
Days where everything lined up — a stricter count that sits next to logged days, so you can see the difference between showing up and nailing it.
A habit prompt when you are close
SlimAI nudges with how many days remain before a run turns into a habit, so a streak in progress has a next milestone instead of an open ended number.
Three achievements, and the ladder to them
Streak Pal — a whole Monday-to-Sunday week with every day logged. Health God — every logged day in the window clean of heavily processed food. Activity Master — 1,000 kcal burned. Each is measured inside the week or month you have selected, so the badge always answers a question about the period you are looking at.
Locked badges show what is left, not nothing
Every achievement is always on screen. The ones you have earned are lit; the rest are dimmed with the rule that earns them, how far the window has come (“4 of 7 days”), and what is still missing (“3 days to go”). The closest one carries a Next up chip and the header keeps a running tally — 2 of 3 unlocked — so “what do I do next” has an answer even before you have earned anything.
Goal reached days
Days where you landed on your calorie goal are marked, so a strong stretch is visible at a glance rather than reconstructed from a chart.
Week and month views
Switch between a week strip and a month view to see whether a bad stretch was a genuine slide or two ordinary off days close together.
The Body Tab: The Trend Behind the Scale
Body weight moves day to day for reasons that have nothing to do with fat — water, sodium, sleep, digestion, and the time you stepped on the scale. Read as single numbers, that noise looks like failure on a Tuesday and success on a Friday.
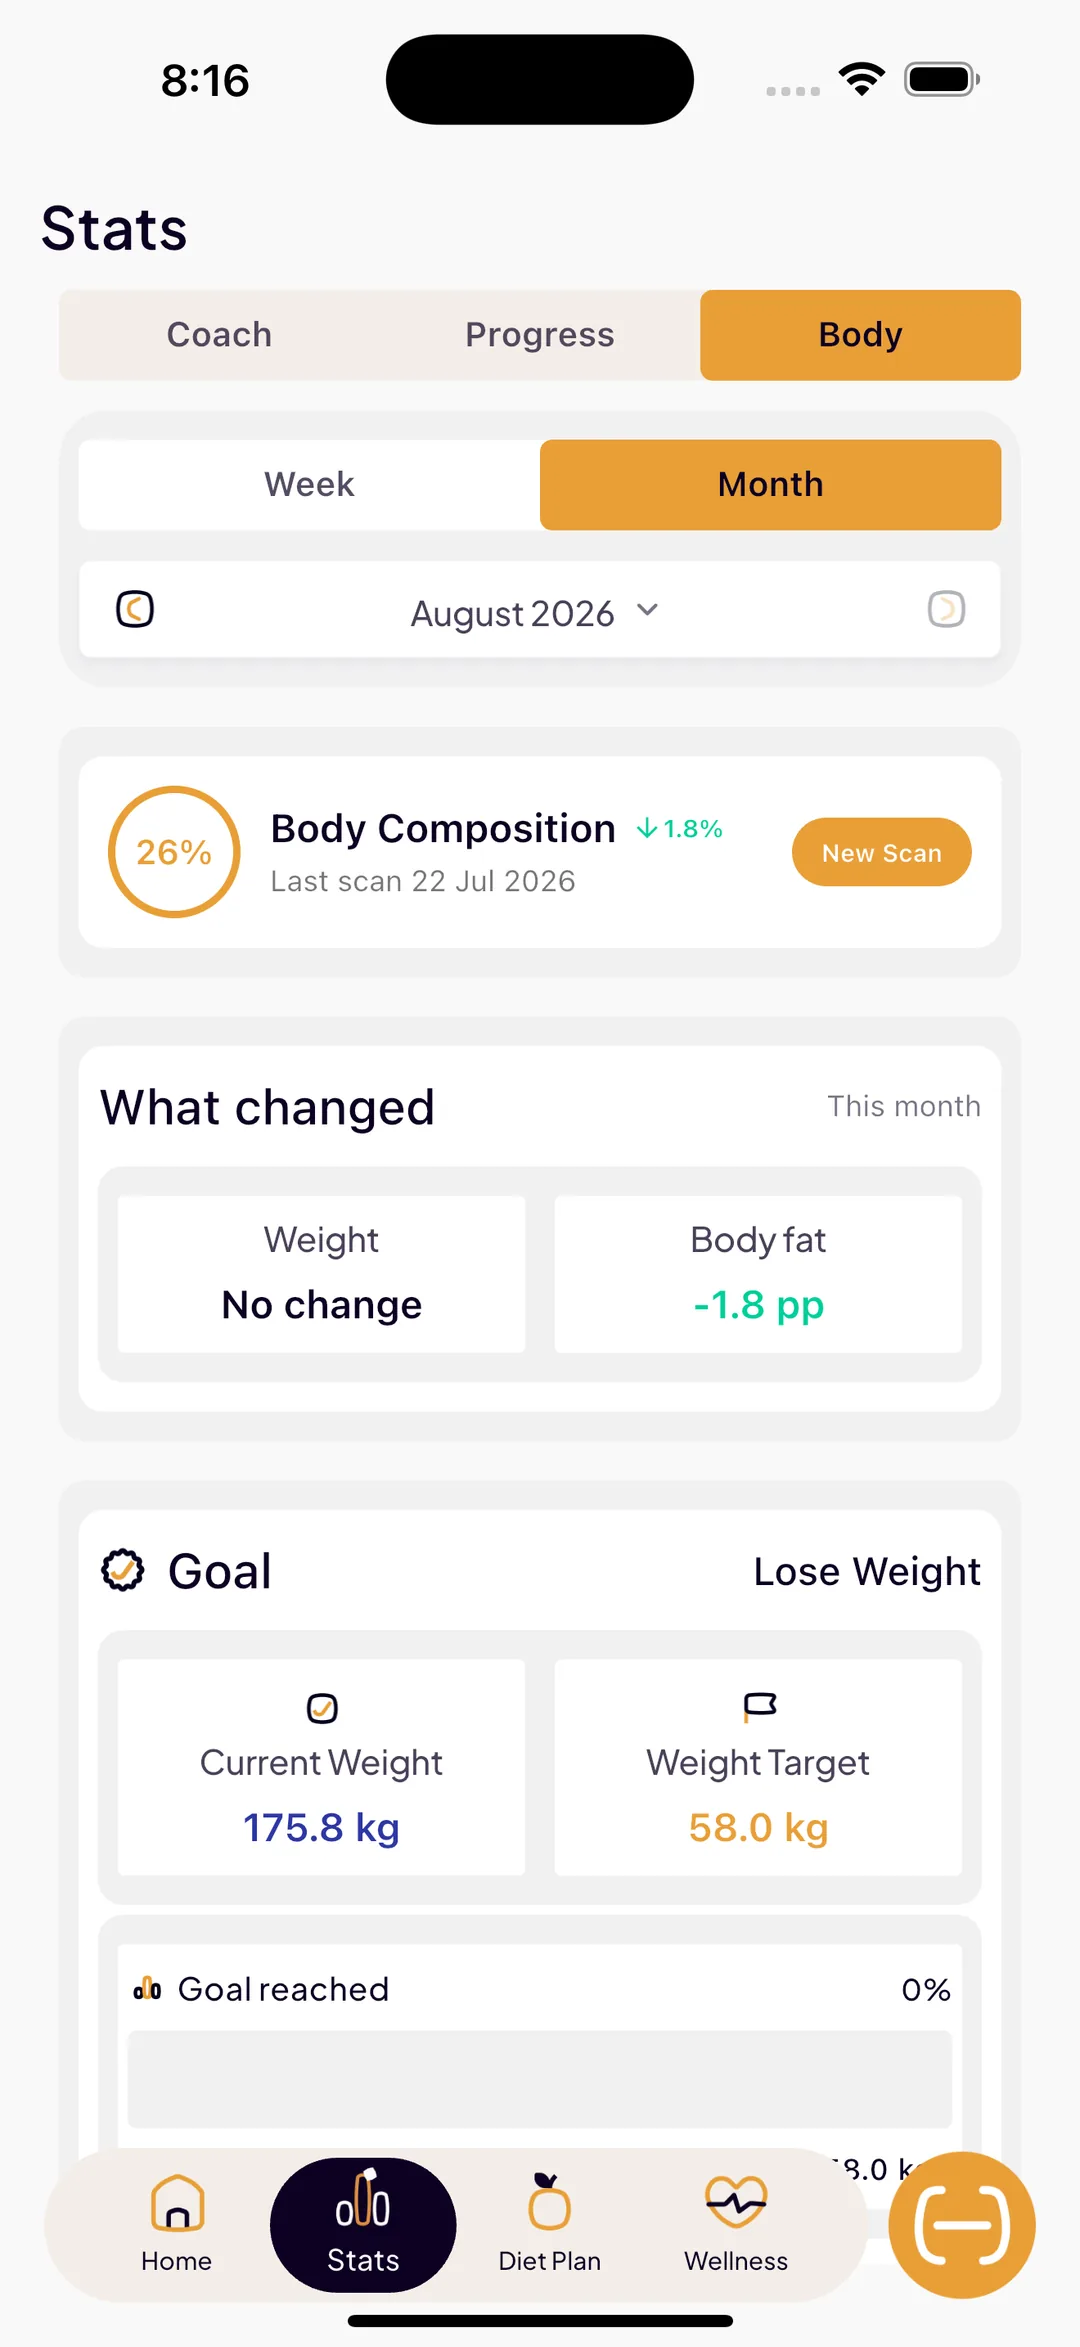
The Body tab plots your entries over time so the direction is what you see first. Alongside it sits your BMI score and, once you have run a Body Assessment, a body fat trend chart plus your scan history — the measure that separates weight you lost from fat you lost.
That pairing matters most when the scale stalls. A flat weight line with a falling body fat estimate describes a very different fortnight than a flat line with no change underneath it.
Weight over time
Logged weights plotted as a trend, so daily fluctuation reads as noise around a direction instead of a verdict.
BMI score
Your current BMI shown alongside the trend, calculated from the height and weight already in your profile.
Body fat trend
Body Assessment results charted over time, so you can see composition change even when total weight barely moves.
Goal progress
Where you currently sit relative to the target weight you set during setup, rather than only where you sit today.
The Charts: What Your Calories and Macros Really Looked Like
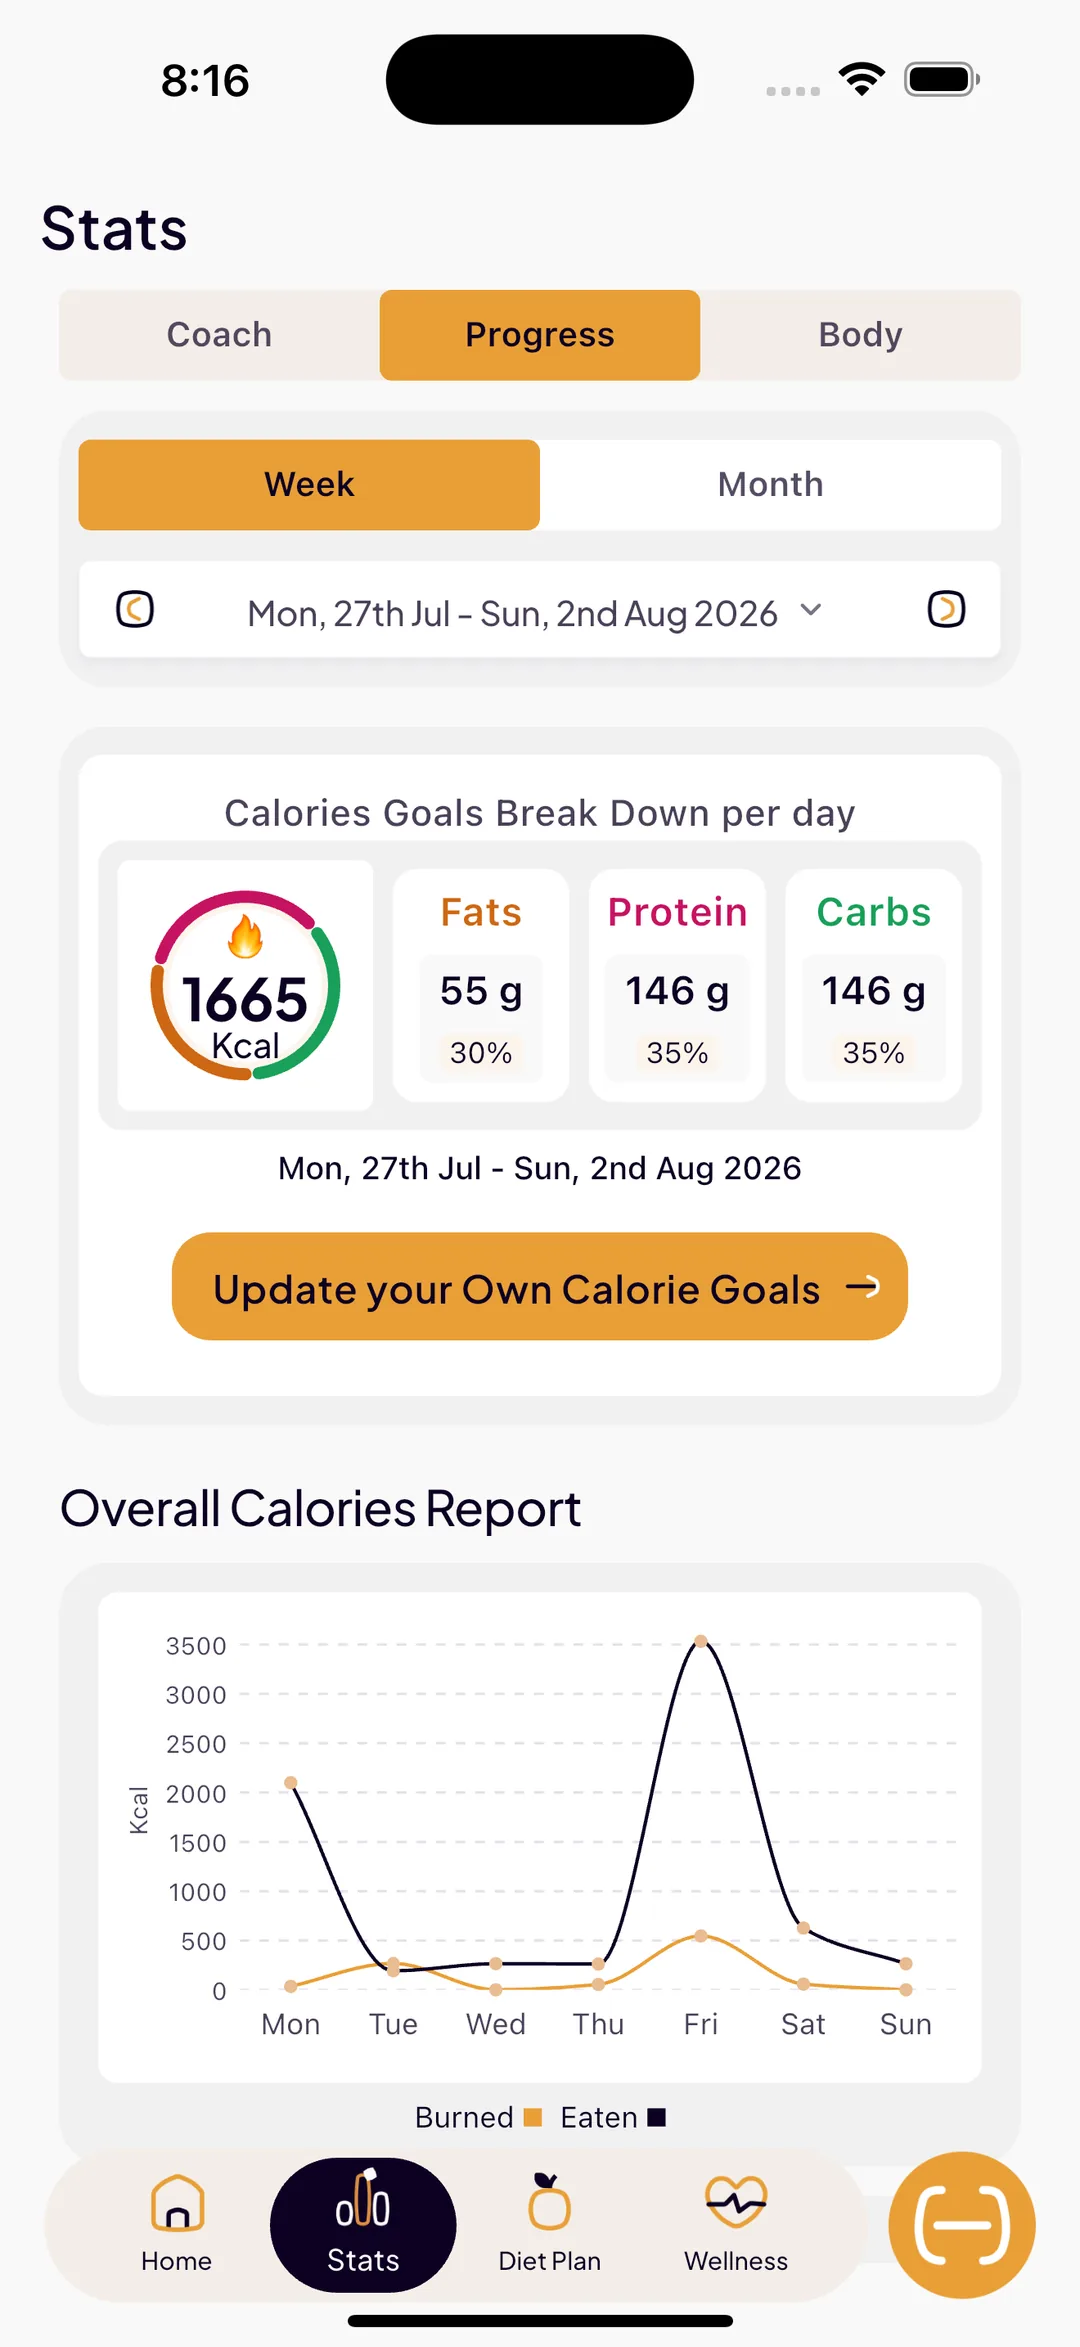
The Progress tab is the review layer. It takes everything you logged and turns it into charts you can read in a few seconds, which is what makes an honest weekly review possible — and it is the evidence sitting behind whatever the Coach tab just told you.
Calorie charts over time
Daily intake plotted against your goal, so a week of small overshoots is as visible as one dramatic day.
Macro breakdown trends
Protein, carbohydrate, and fat charted across the period, which is usually where a stalled result gets explained.
Intake against activity
What you ate sits in the same app as workouts and steps, so the balance side of the picture is not in another product.
Period switching
Move between weeks and months to compare a rough stretch against a good one instead of trusting memory.
How to Use the Stats Screen
The screen rewards a short, regular visit far more than an occasional deep study. A weekly rhythm is enough.
Start on Coach, not on a chart
Coach opens by default because it answers the question you actually came with. Use Progress to check its work, not to find the story yourself.
Check Progress weekly, not daily
Streaks are a motivation tool. Looking every hour turns them into pressure; looking every Sunday turns them into feedback.
Read weight as a line, never a point
Compare this week average to last week average. A single morning reading is the least informative number on the screen.
Use the charts to explain a plateau
When results stall, the macro and calorie charts usually show the cause — a protein drop, a creeping weekend, or a goal that no longer matches your activity.
Treat a broken streak as one day
Logged Days and Longest Streak exist so a gap stays a gap. Log the next meal and the record you already set is still there.
What These Numbers Are
Calorie, portion, and burn figures throughout SlimAI Calorie Tracker are estimates, so every chart built from them inherits that. Trends are more reliable than single points, and direction is more reliable than magnitude.
BMI is a screening ratio of height and weight, not a measure of body composition — a muscular person and an untrained person at the same BMI have very different bodies, which is why the body fat trend sits beside it. Body Assessment results are science-based estimates for fitness purposes, not a medical diagnosis.
None of this replaces professional advice. If a trend concerns you, or you have a medical condition, speak to a qualified health professional.
Explore More SlimAI Features
 FAQ
FAQ
Still Wondering About SlimAI
 Does SlimAI track logging streaks?
Does SlimAI track logging streaks?Yes. The Progress tab shows your Longest Streak, your Logged Days, and your Perfect Days, and prompts you with how many days remain before a run becomes a habit. Streaks are shown so that a missed day reads as one gap in a run rather than a reason to stop tracking.
What achievements can I earn in SlimAI?
What achievements can I earn in SlimAI?Three: Streak Pal, for a whole Monday-to-Sunday week with every day logged; Health God, for keeping every logged day clean of heavily processed food; and Activity Master, for burning 1,000 kcal. Each is measured inside the week or month you have selected, so a badge always answers a question about the period on screen. All three are always visible — the ones you have not earned yet show the rule, your progress toward it, and what is still missing, with a Next up chip on the closest one and a running “2 of 3 unlocked” tally in the header.
What are the three tabs on the SlimAI stats screen?
What are the three tabs on the SlimAI stats screen?Coach, Progress, and Body — one question each. Coach opens by default and answers what to do now: your trajectory, week score, wins and watch-outs, what drove your calories, and this week's lesson. Progress answers how you are doing, with streaks, achievements, and the calorie and macro charts. Body answers how your body has changed, with body composition, body fat trend, weight, BMI, and scan history. One shared week or month selector drives all three.
What is a perfect day in SlimAI?
What is a perfect day in SlimAI?Perfect Days is a stricter count than Logged Days. Logged Days counts every day you recorded food at all, while Perfect Days counts the days where everything lined up. Having both on screen separates showing up from hitting your targets, so consistency is credited even on days that were not flawless.
Can I see my weight and body fat over time?
Can I see my weight and body fat over time?Yes. The Weight tab plots your logged weights as a trend, shows your BMI score, and charts your Body Assessment body fat estimates over time. That pairing is useful when the scale stalls, because a flat weight line with a falling body fat estimate is a different result from no change at all.
What do the charts in SlimAI show?
What do the charts in SlimAI show?The Progress tab charts what you actually logged: daily calories against your goal, protein, carbohydrate, and fat trends across the period, and your intake alongside logged activity. You can switch between week and month views to compare a difficult stretch with a good one instead of relying on memory. The Coach tab reads the same data and states the conclusion in a sentence.
How often should I check my progress?
How often should I check my progress?Weekly is usually enough. Streaks work as motivation when you check them occasionally and as pressure when you check them constantly, and weight is only meaningful compared week to week rather than morning to morning. A short Sunday review of Progress, Weight, and Insights covers most of what the screen is for.
Are the trends in Statistics exact measurements?
Are the trends in Statistics exact measurements?No. Calorie, portion, and burn figures in SlimAI are estimates, so charts built from them show direction more reliably than magnitude. BMI is a height-and-weight screening ratio rather than a body composition measure, and Body Assessment results are science-based estimates for fitness purposes, not a medical diagnosis.
Start logging smarter with AI Meal Logging.
Log any meal, any way. Get instant calories and macros. Build the habit that sticks.
Free 3-day trial, then $7.99/month or $29.99/year. Cancel anytime.
- 50K+ food items in the food database
- 10K+ downloads on iOS and Android
- 7 languages
- 4.5★ App Store · 4.8★ Google Play (as of September 3, 2026)